Solar drag is uninsurable — and not because the risk is small
As far as I can find, no policy pays when the solar cycle drags a working satellite out of orbit early. Storms are a dot; the solar cycle is the band, and it deals one hand every eleven years.
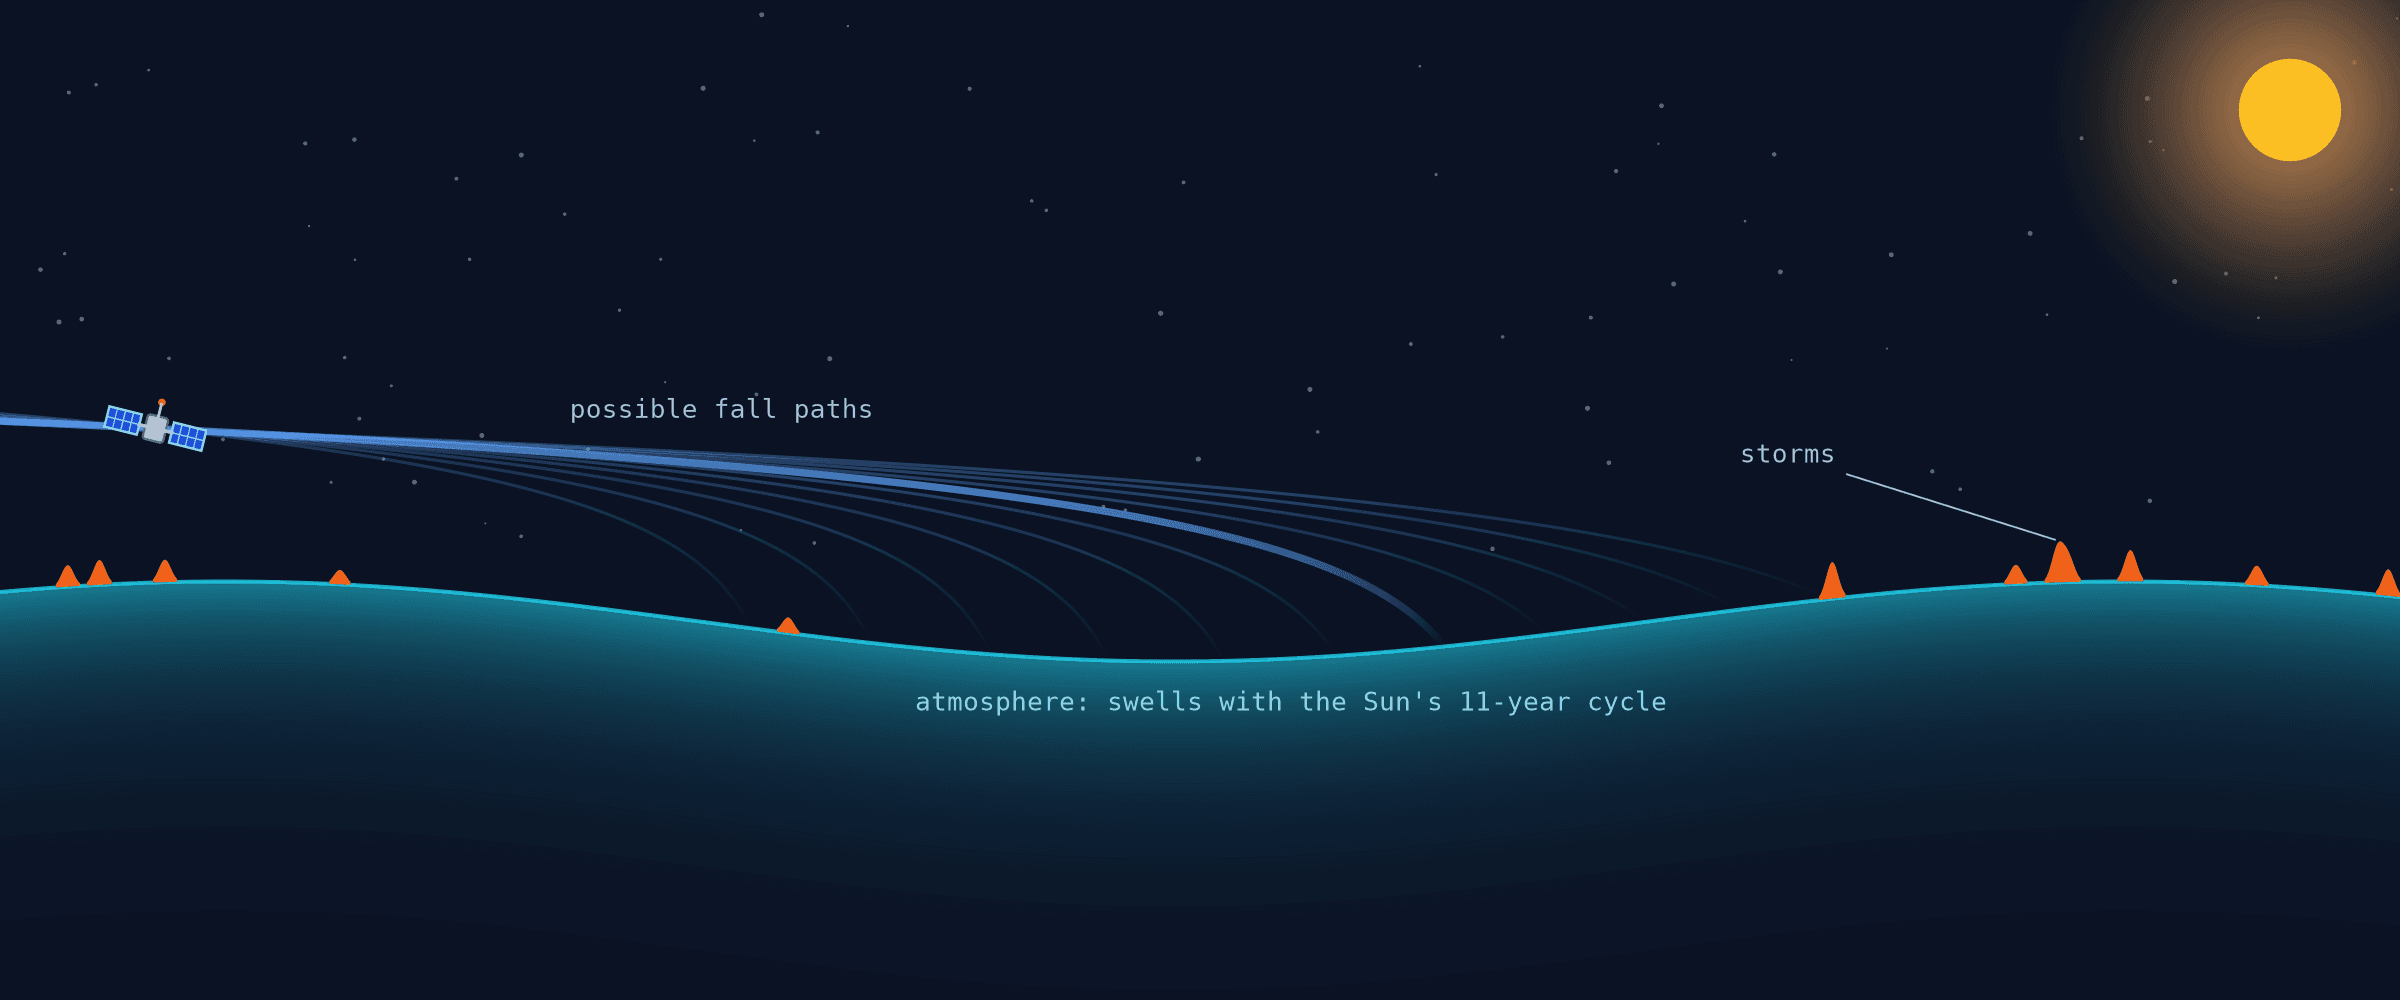
As far as I can find, no policy pays when the solar cycle drags a working satellite out of orbit early. That surprised me, and nobody could tell me why, so I went back to my roots in space weather modeling to find out.
What satellites are insured against
Space insurance follows a satellite through its life, one policy per phase. In 2025, only about 300 of the roughly 10,000 satellites then in orbit were insured against their own loss (Clyde & Co, Sep 2025); there are now about 16,800 working satellites.
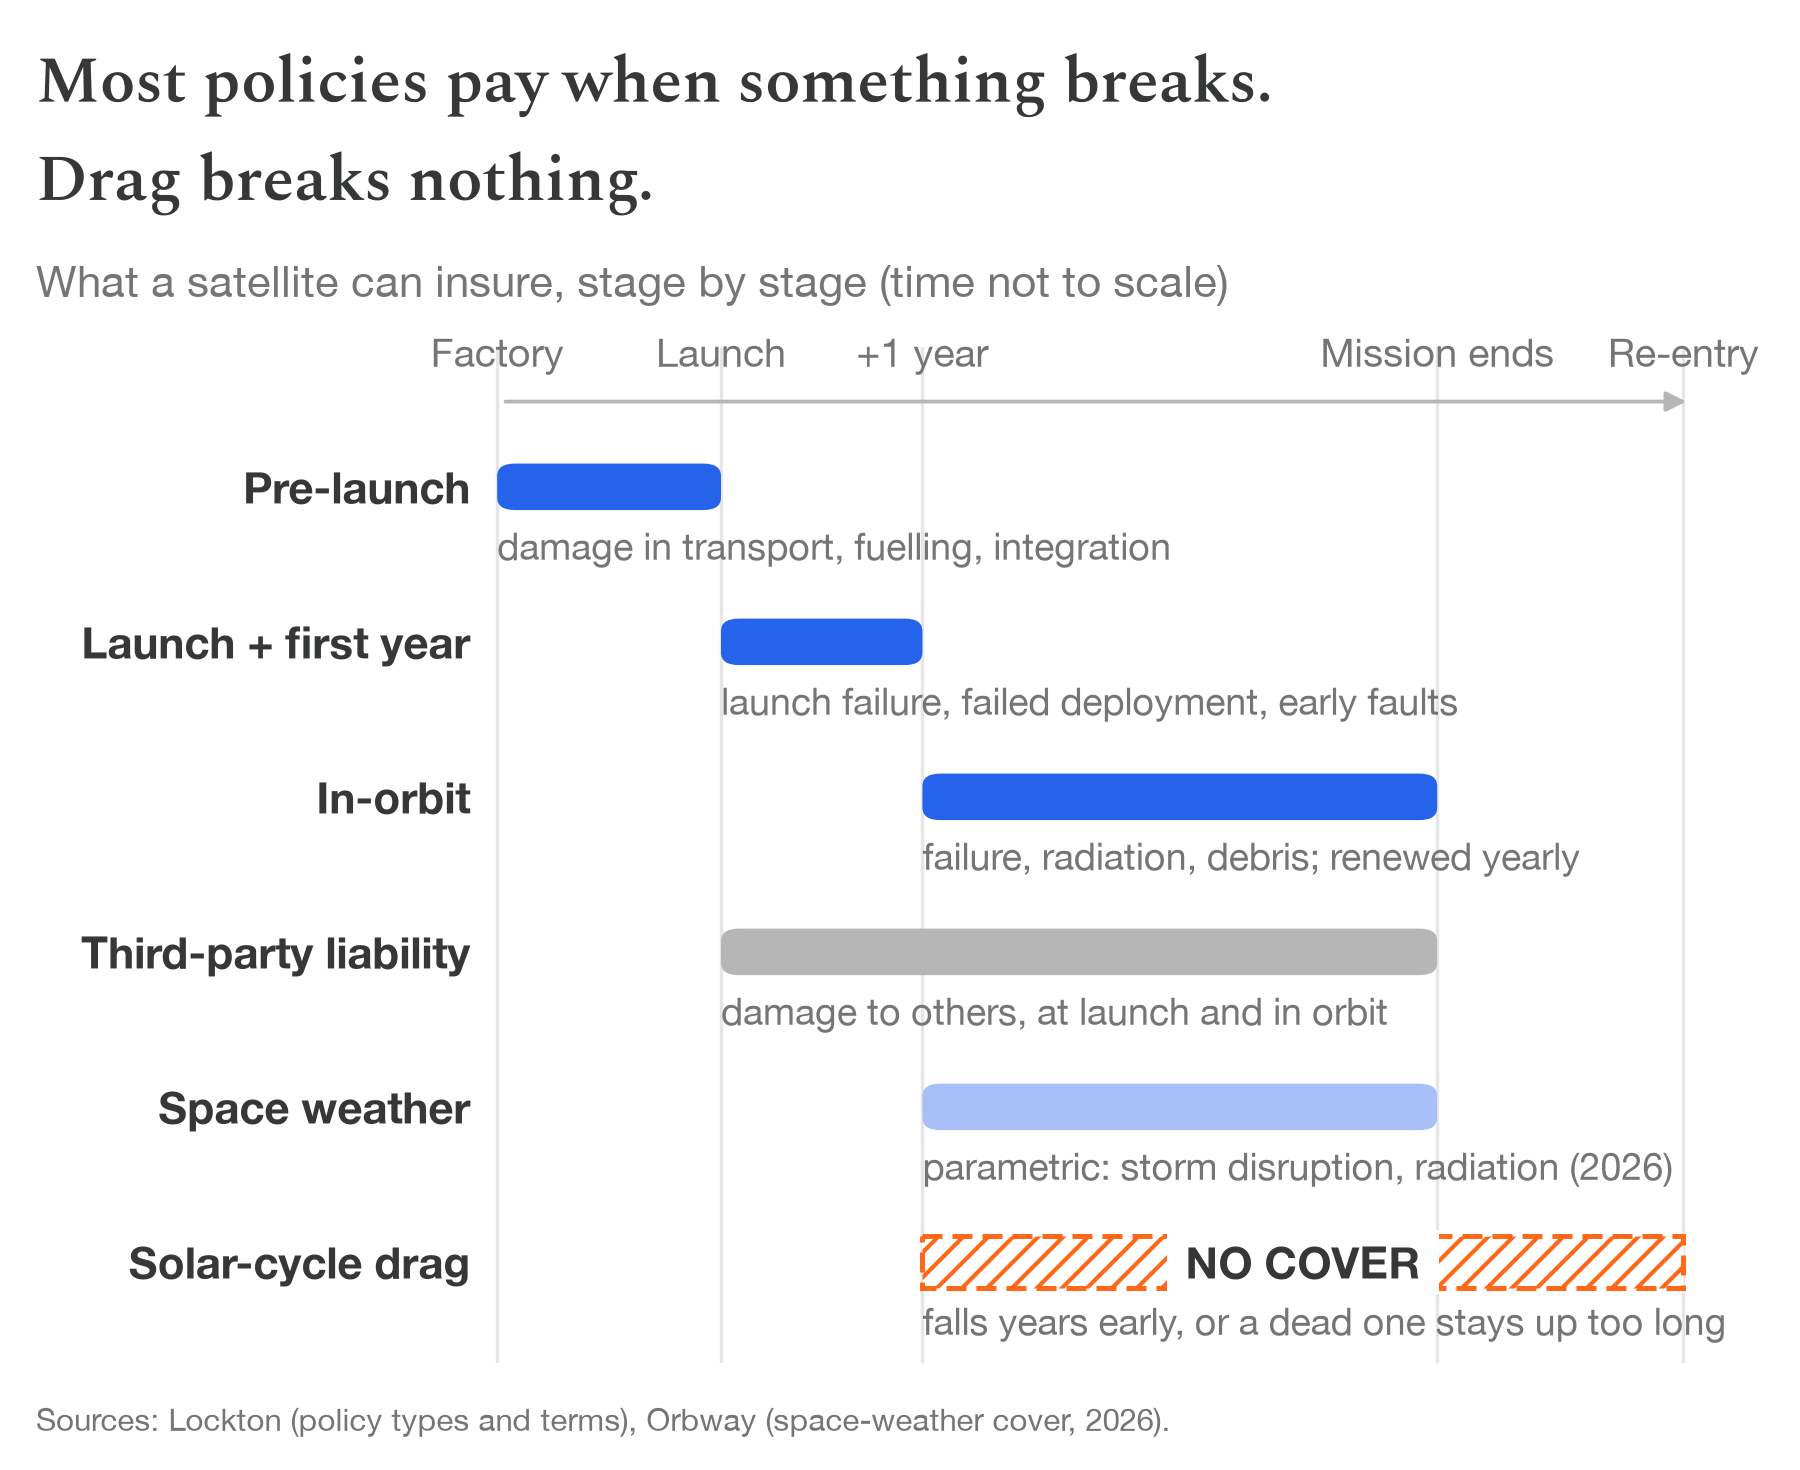
Most policies pay when something breaks: a launch fails, an antenna won't deploy, a power system dies. The Sun hurts satellites in two ways.
Radiation: charged particles hit the electronics. Sometimes they destroy a part, and policies usually pay for that. More often they cause an outage: the satellite drops into safe mode for hours or days, then recovers. Nothing is broken, so policies mostly don't pay; one start-up, Orbway, now sells parametric cover for those outages.
Drag: the Sun's ultraviolet heats the upper atmosphere, which swells outward, so a satellite in low orbit ploughs through denser gas and falls sooner. How much it swells follows the Sun's roughly eleven-year cycle of activity: most near solar maximum, least near solar minimum. Nothing breaks: the orbit just wears down, month by month, in plain view. Policies typically exclude problems already known when they are written (Spire 10-K), and lost altitude is known as soon as the tracking data shows it.
The bet
Space insurance grew up around geostationary satellites: a few machines worth hundreds of millions each, 36,000 km up, where there is no drag. The fleet has since flipped. Most satellites now fly in low orbit, where the upper atmosphere decides how long they live, and under 2% of them carry even the standard in-orbit policy (Innovation News Network). My thesis was that insurers had not caught up, and that drag was the place to start.
The bet was about storms. A geomagnetic storm swells the atmosphere for a few days and speeds up a satellite's fall. Model the extreme storms well, and sell a policy that pays for the orbit life a storm takes, triggered automatically when a storm index crosses a threshold. It looked strong for three reasons:
- The loss is real. Spire Global, a data and intelligence company for space observations, cut the useful lives of 43 satellites in 2023, blaming "increased solar activity" (10-K).
- Storms do visible damage, and their rate swings. In February 2022 a moderate storm brought down 38 of 49 freshly launched Starlink satellites, still in their low deployment orbit, and the rate of extreme storms varies more than a hundredfold between solar cycles (Riley & Ben-Nun 2025).
- There are buyers. Starlink can absorb the loss itself; smaller operators can't. More than a third of their satellites (1,262 of 3,451)¹ fly at 500–600 km, where the air is thin enough for years of flight but thick enough that the Sun decides how many.
So I built a lifetime model for a typical small satellite without thrusters and shook it two ways: with simulated storms, based on almost 70 years of records, and with a Sun that stays stronger or weaker than forecast for the rest of the satellite's life, by about as much as forecasts really miss.
Storms are a dot
How much drag a satellite feels over its life depends mostly on its altitude, because air density falls off steeply with height. Below about 400 km, a dead satellite comes down within a year or two whatever the Sun does. Above about 700 km, it stays up for decades to centuries and drag barely matters. In between, where most small satellites fly, the fall takes from under a year to several decades, and the Sun decides where in that range it lands.
Take 550 km, in the middle of that range. There, a typical run of storms brings a satellite without thrusters down 17 days sooner if its mission ends near solar minimum, and 75 days sooner if it ends near solar maximum. Not knowing how strong the Sun will be spreads its fall over a window 3 years 5 months to 6 years 10 months wide.
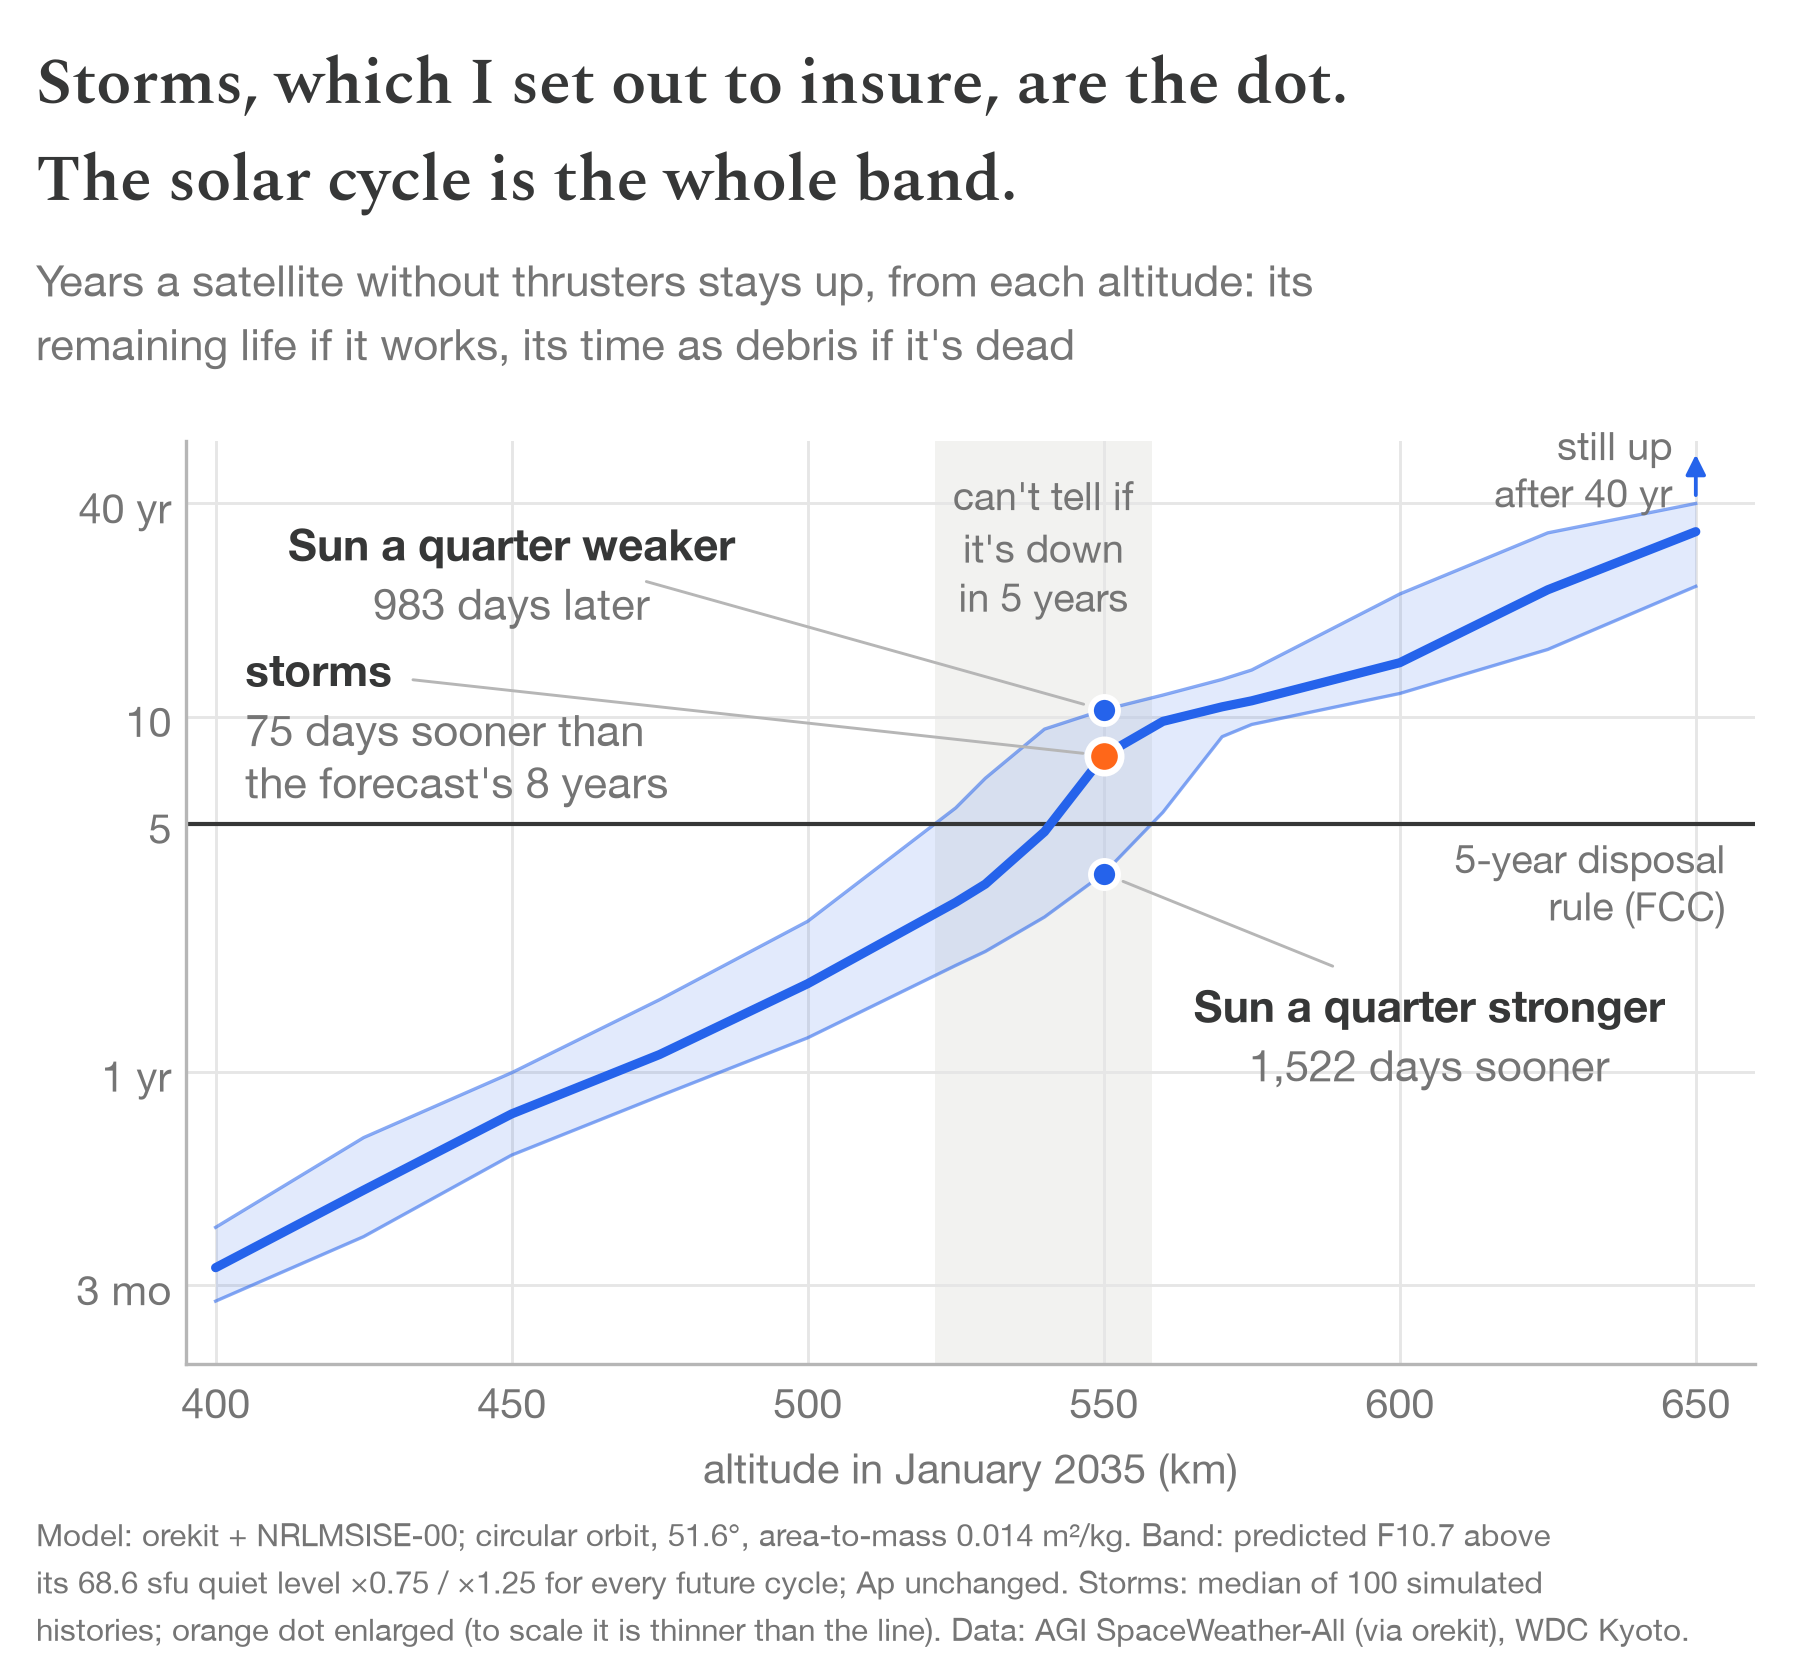
For a working satellite, that fall time is its remaining life; for a dead one, it is time spent as debris.
The line uses the default solar forecast that orbit propagation software reads²; the band is the same fall if the Sun stays a quarter weaker or stronger than that for the rest of the satellite's life. The current cycle, Cycle 25, peaked 22% above the average of 128 numerical forecasts and 40% above the official 2019 NOAA/NASA forecast.
A storm-drag policy would pay out when a storm drags a satellite down early, as in the Starlink loss of February 2022, triggered when Kyoto's Dst index, the standard measure of storm strength, crosses a threshold. It would cover the orbit life storms take: the orange dot. The band is roughly 30 to 70 times wider than that; on the chart, storms don't even move the dot off the blue line. Even like for like, since storms and a stronger Sun both bring the satellite down sooner, a Sun a quarter stronger than forecast takes about 20 times as much orbit life as storms do. A storm raises drag sharply, but only for a few days; the Sun's baseline presses for years, and every kilometre it takes puts the satellite into thicker air, so the losses compound. A storm policy, insuring drag, would cover the dot and leave the buyer holding the band. Insurers call that basis risk.
The band cuts the other way too. So far the risk was a satellite falling too early; regulators worry about one falling too late. A dead satellite can't actively avoid collisions, and one collision scatters thousands of fragments across an orbit everyone shares: the 2009 Iridium–Cosmos crash left over 2,000 tracked pieces. So the US FCC tightened its rule: low-orbit satellites licensed in the US or serving its market, launched since September 2024, must show, before launch, that they will be gone within five years of their mission ending, down from a 25-year guideline (FCC 22-74). At 500–600 km, where more than a third of the satellites outside the megaconstellations fly, a weak Sun can keep a satellite up past that deadline.
In our model, a satellite whose mission ends in January 2035 anywhere between roughly 520 and 560 km may or may not be down within the five years: with a weaker Sun it stays up past the deadline, with a stronger one it falls in time. When the operator has to show compliance, before launch, no model can say which; the best it can give is a probability that turns on how strong the next solar cycle turns out. Forecasts sharpen once that cycle is under way, but by then the satellite is built, licensed and flying.
So the question stops being about storms. It becomes: can anyone forecast how strong the coming solar cycles will be, or at least price that variation, the band in Figure 1?
Nobody can forecast the band
Of the 128 forecasts in Karak's review that put a number on the peak of Cycle 25, 106 came in below what the Sun actually did (Karak 2026).
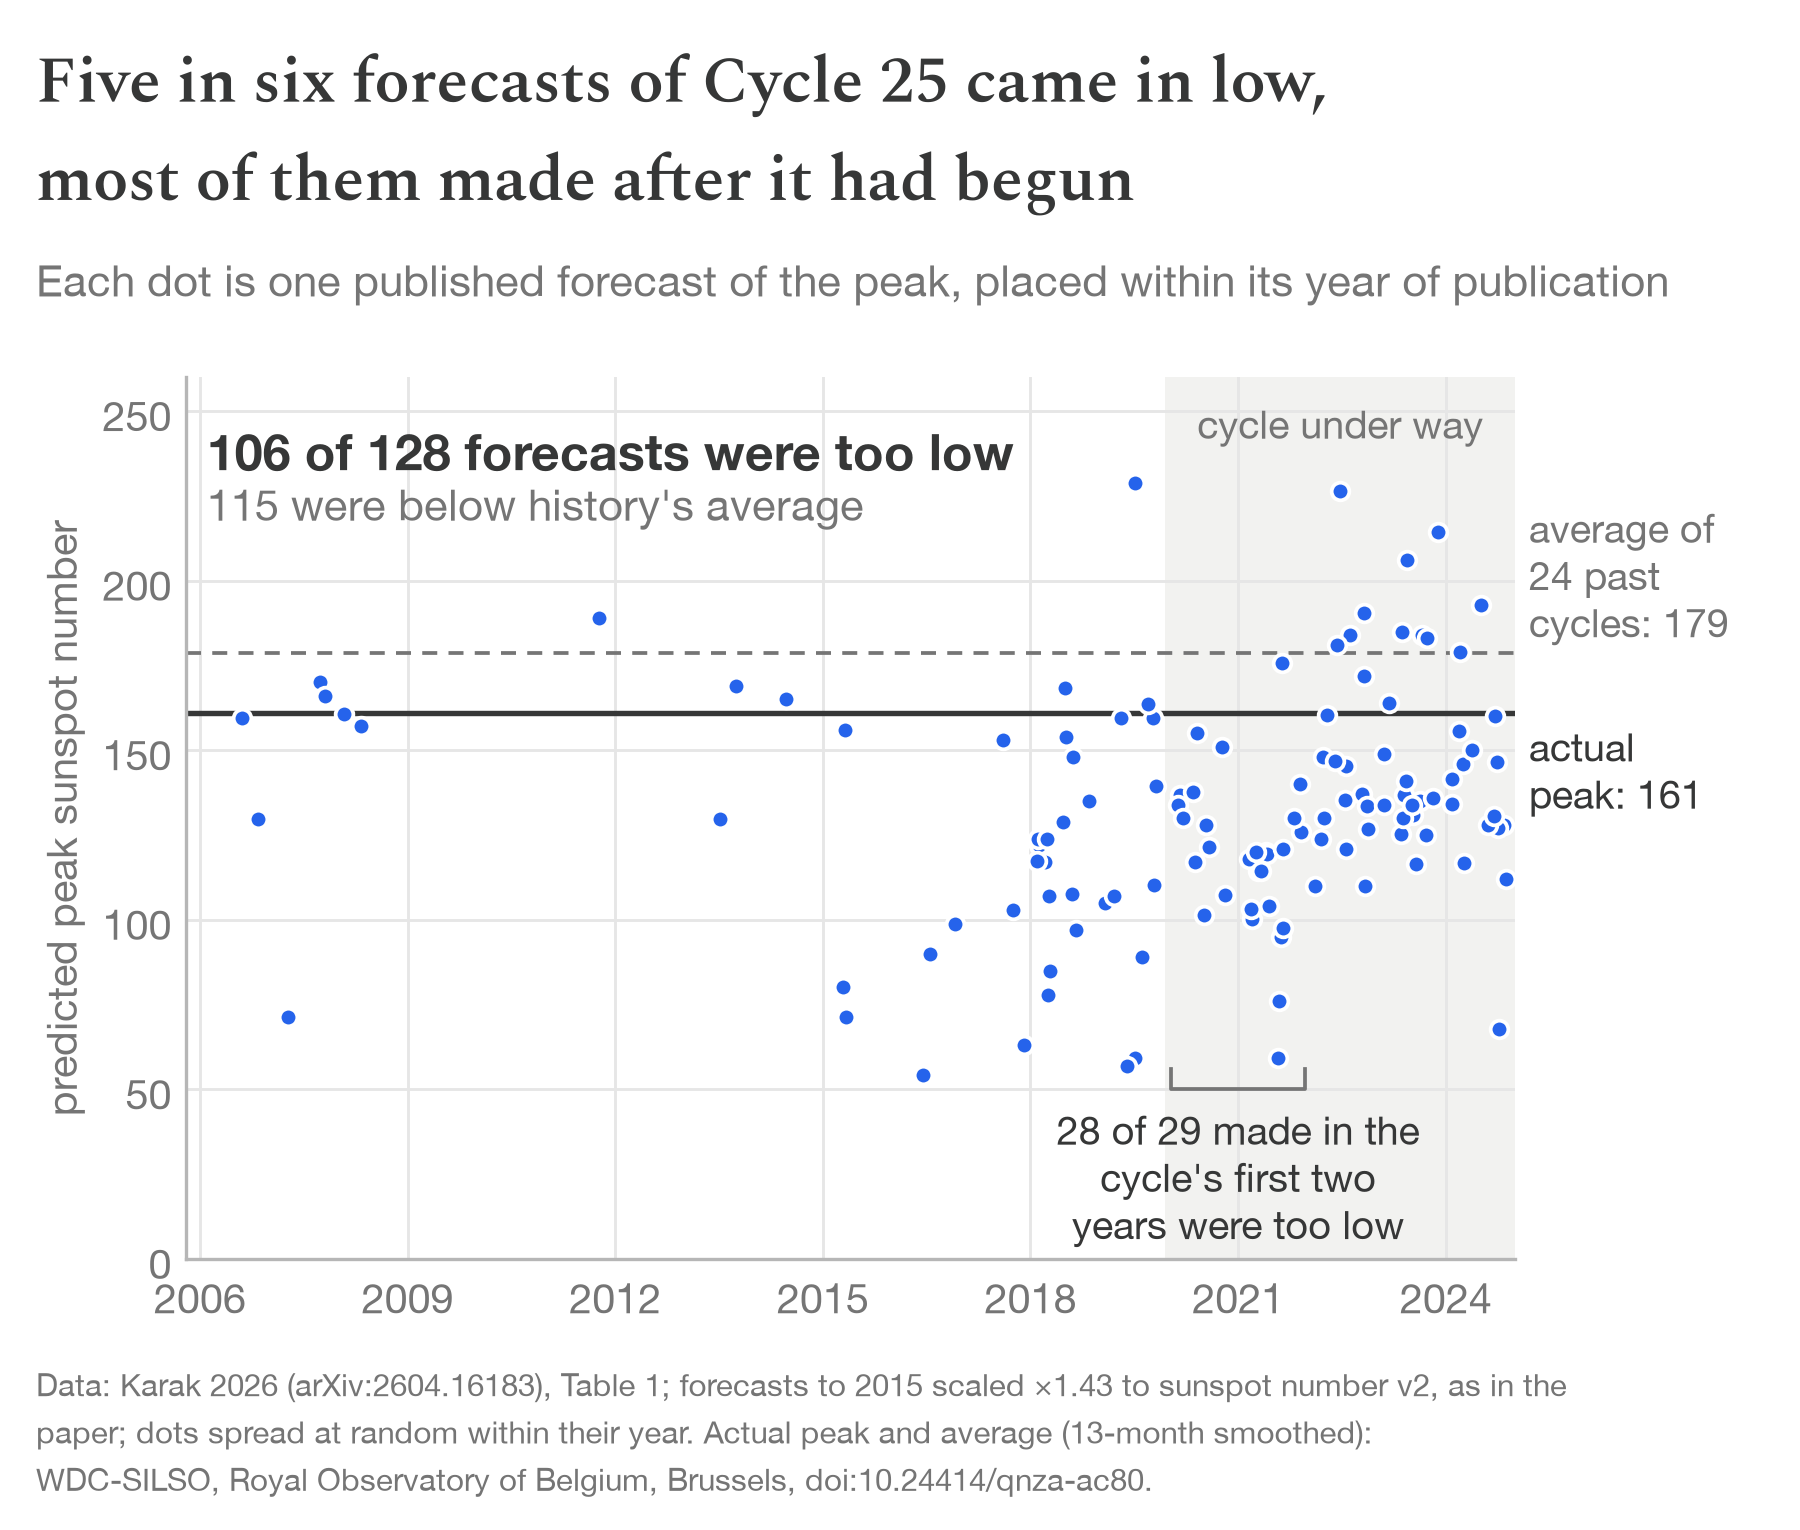
Waiting helped, but only late. Forecasts made in the cycle's first two years were the worst: 28 of 29 too low. Even in 2024, the year of the peak, 14 of the 16 published were still too low. A satellite is designed and launched years before that.
The misses lean low: the official panel expected Cycle 25 to be "similar to Cycle 24", the weakest in a century (NOAA, Dec 2019). That is bias, and it could be fixed. The spread can't be. The cycle comes from the magnetic dynamo inside the Sun, which is still not fully understood and partly random (Jiang et al. 2014). The best clues to the next cycle only build up during the one before it, so observations can see about one cycle ahead, and Karak's review calls any prediction made before the previous cycle has peaked "meaningless". Beyond that, orbit propagation software falls back on placeholders: past cycles replayed at random, which gives a spread and not a forecast, or one fixed cycle repeated into the 2090s, which the default input file itself calls "a notional representation"².
Why the cycle can't be insured
Insurers don't need predictions. They need counts.
Nobody can predict an earthquake, yet insurers cover them, because the Earth supplies data by the thousand. For every magnitude 7 there are about ten magnitude 6s and a hundred magnitude 5s, so the thousands of small quakes each year tell you how often the big ones come, and the big ones are rare. And faults all over the world give an insurer many independent bets. Storms sit closer to earthquakes: the hourly storm index, measured since 1957, records about 390 intense storms³ in almost 70 years, a few every year. That is enough to fit how often the extreme ones come, following Riley & Ben-Nun 2025, and so to price the dot.
The solar cycle breaks all three things that make earthquakes insurable:
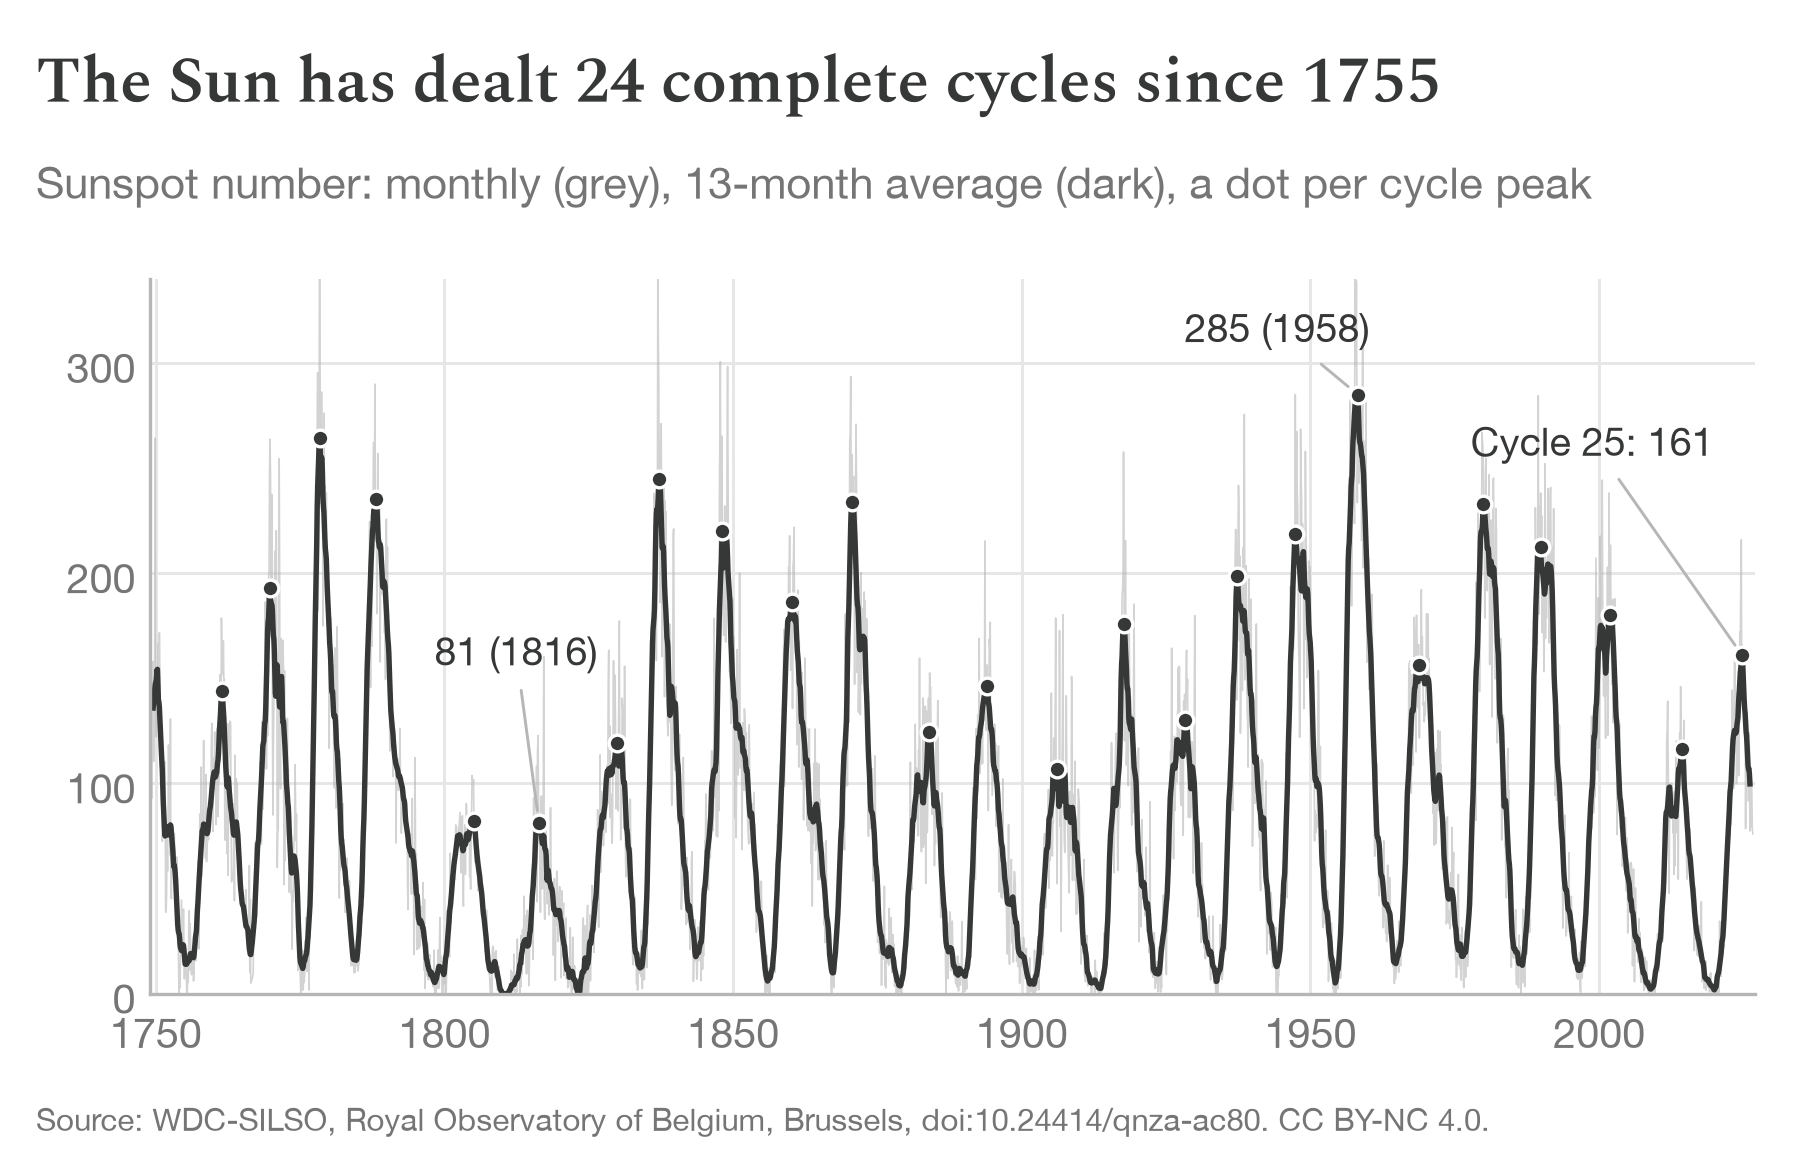
- One draw every eleven years. Sunspot counts track the Sun's ultraviolet output, and so drag. Records since 1755 hold just 24 complete cycles, peaking anywhere from 81 to 285. That is all the data there is: 24 points to price from.
- The same draw for everyone. One cycle sets the drag for every satellite in orbit at once. An insurer can't spread it across its book, and waiting for it to average out takes a century.
- A big miss is normal. In more than half of past cycles, the peak landed more than 25% away from the average of all the cycles before it. Figure 1's band is the size of an ordinary miss, not the tail. If anything it sits low: in the radio flux that drives drag, the default forecast is about as weak as Cycle 24, and five of the seven cycles measured in radio flux beat even the band's strong edge.
So history gives a price, but not one worth paying. A miss on the strong side, the kind that brings satellites down early, came in about one cycle in three, and every policy takes it at once, so nothing offsets it. An insurer must hold capital against its whole book for years and charge for it, so the price lands at a large share of the loss itself. And lost altitude shows in tracking data month by month, so a yearly policy is repriced before it ever pays.
Spire shows the result. Its 10-K reports no insurance claim for the 43 satellites, and says its insurance "does not protect us against business interruption, loss of revenues". Spire just wrote the satellites off faster in its accounts, which added about $2.5 million of depreciation over two months (10-K). For the 1,597 satellites without thrusters that one study could verify, the current cycle cost about 688 mission-years, some $0.88 billion, even measured against the pessimistic edge of the official forecast (Shambaugh 2026).
What operators need instead
An operator with a handful of satellites can't buy a payout worth its price. They need to know when each satellite will come down, early enough to order its replacement, write down its value, or plan its disposal. At launch the honest answer is a band as wide as Figure 1. But unlike a policy, an answer can keep improving: forecasts close in once a cycle is under way, and every month of tracking data shows how fast a satellite is really sinking.
The Sun deals one hand every eleven years. The best an operator can do is watch it being dealt.
Written with AI agents as sparring partners; every number reproduces from the repository.
Code, data and methods: github.com/gordonkoehn/solar-drag-uninsurable · PDF · doi:10.5281/zenodo.22996332. Lifetime model: orekit with the NRLMSISE-00 atmosphere, checked on one real re-entry (CIRBE); storms and the Sun are compared inside the same model, so the point rests on the comparison, not on exact fall dates; default solar input from AGI's SpaceWeather-All file as bundled with orekit; storms: extreme-value fit to 69 years of Kyoto Dst (1957 to 2026; WDC for Geomagnetism, Kyoto, doi:10.17593/14515-74000); sunspots: WDC-SILSO, Royal Observatory of Belgium, Brussels (doi:10.24414/qnza-ac80); forecasts: Karak 2026, Table 1.
¹ Satellite count. CelesTrak's public satellite catalogue, August 2026 snapshot: payloads in low orbit that CelesTrak marks as working, minus the five megaconstellations (Starlink, OneWeb, Kuiper, Qianfan, and Guowang, which CelesTrak lists as Hulianwang). That leaves 3,451 satellites, and 1,262 of them have their lowest point between 500 and 600 km. About 280 of those are government or military, such as the US "USA" series and China's Yaogan; without them the share is still about a third (986 of 2,883). The working/dead flag is CelesTrak's best public estimate, so read these as rough shares, not exact figures.
² Default solar input. The file that the open-source orekit library and AGI's STK software read by default is AGI's SpaceWeather-All: after the observed record, it takes NASA Marshall's average cycle for the next cycle and repeats it into the 2090s. ESA's lifetime tool can instead replay past cycles at random (OSCAR).
³ Intense storm. Storms are measured with Dst, an hourly index from magnetometers at low latitudes that tracks the electric current a storm drives around the Earth, in nanotesla: near zero when quiet, sharply negative in a storm. The standard classification calls a storm intense when Dst falls below −100 nT (Gonzalez et al. 1994); the March 1989 storm that blacked out Québec reached −589 nT. Following Riley & Ben-Nun, a storm runs from when Dst drops below −20 nT until it recovers above it, so one long disturbance is not counted twice. Record: Kyoto Dst, January 1957 to April 2026, 392 intense storms; on their window to August 2022 our count matches Riley & Ben-Nun's 367 exactly.